In 2016, I joined a Skunkworks team within Stanley Black and Decker to explore realtime tool control and geospatial sensor tag tracking on construction & industrial sites. Below are concepts and builds, some of which were never launched but propelled our team into defining what was ethical and what was feasible within our vertical. 
I was hired to own and nurture the team's design and user-focused philosophy. I worked closely with electrical engineers, contractors in New Zealand and Atlanta, and advocate for a lean approach among our stalwart product team who had been using the same methodologies for 30 years. 
Other aspects of this work not shown: sensors, biometrics, and LoRA tech exploration (under NDA).
Duties and Foci
First project for DeWalt & SBD
Ground-up UI system based on inspiration from physical architecture of power tools
Visiting jobsites and watching users in the wild. Iterating based on pain points
Rapid prototyping in xCode, Sketch and Framer X based on an MVP approach.
The Problem
Clients wanted to know where tools and assets were located on construction sites, in real-time. 

The Solution
Create a mobile and web solution to address Stanley Back and Decker's core customers in order to spatially track assets with disruptive tech (triangular location, Bluetooth and GPS).

My Role
First project for DeWalt & SBD
Ground-up UI system based on inspiration from physical architecture of power tools
Visiting jobsites and watching users in the wild. Iterating based on pain points
Rapid prototyping in xCode, Sketch and Framer X based on an MVP approach.

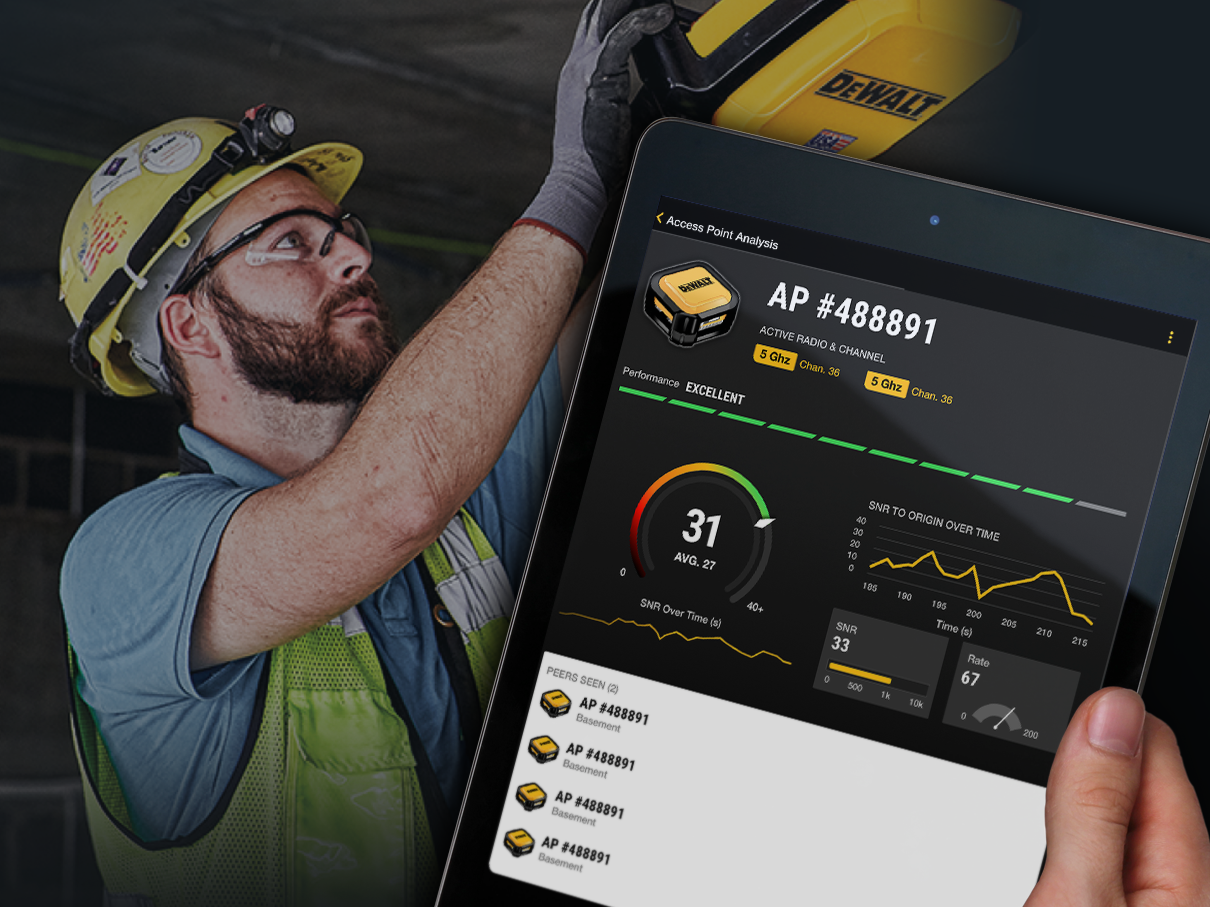
Final UI direction as a native iPad app

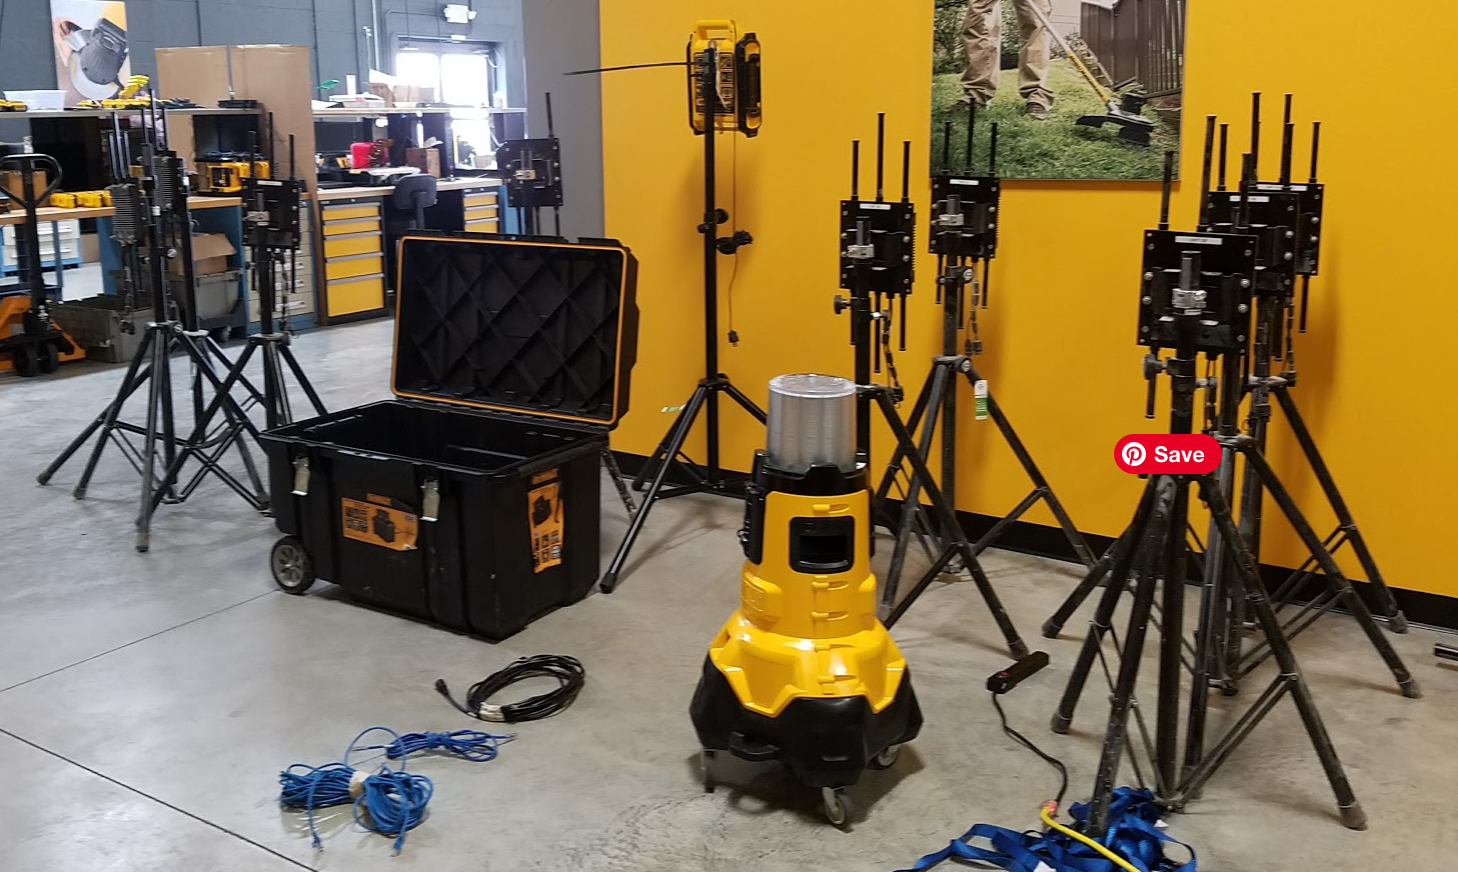
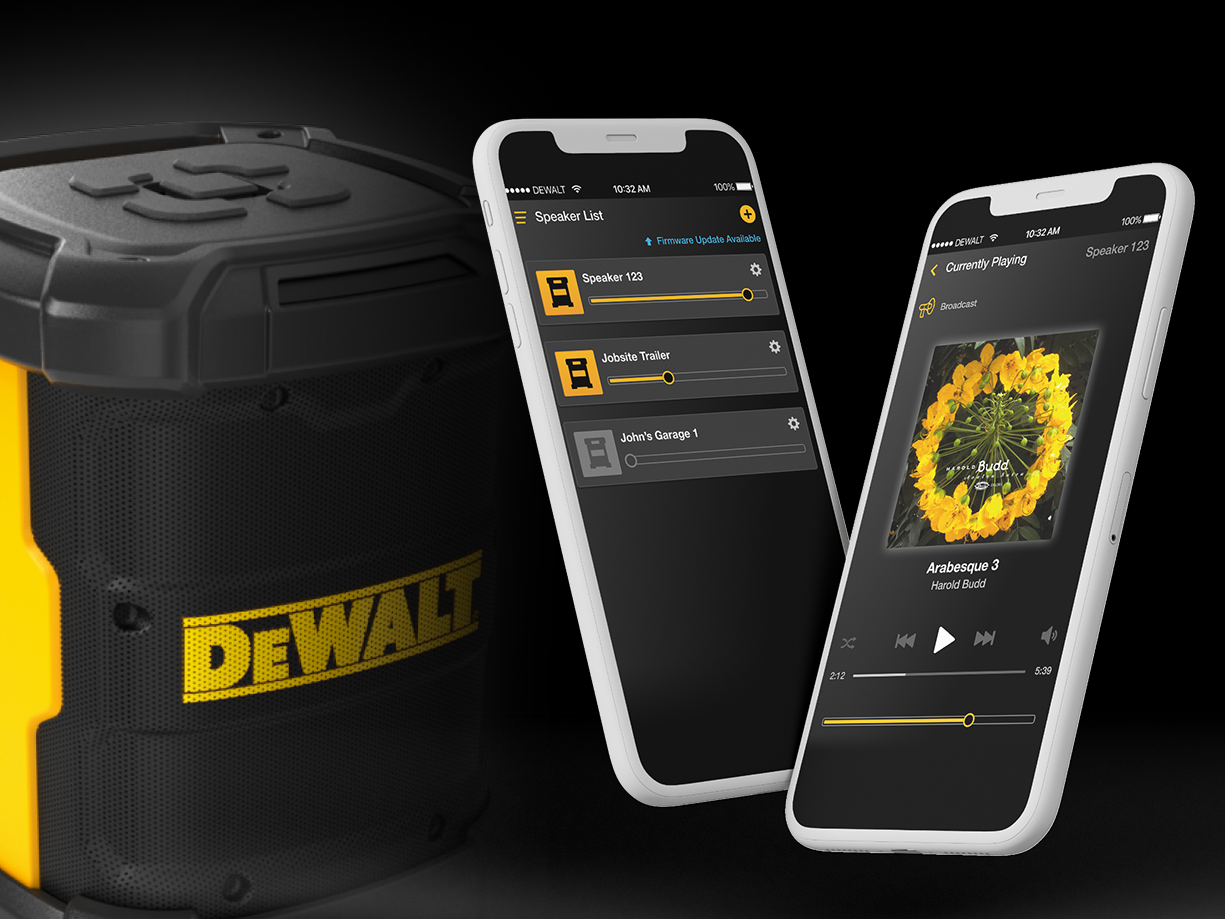
Anchor/Reader units ready for deployment. These are the units that track assets and people.

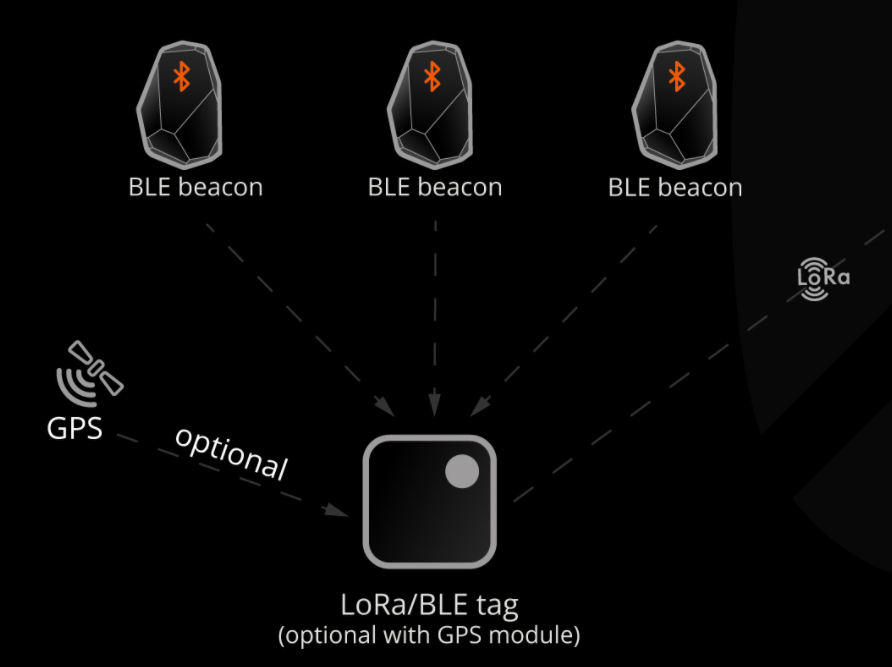
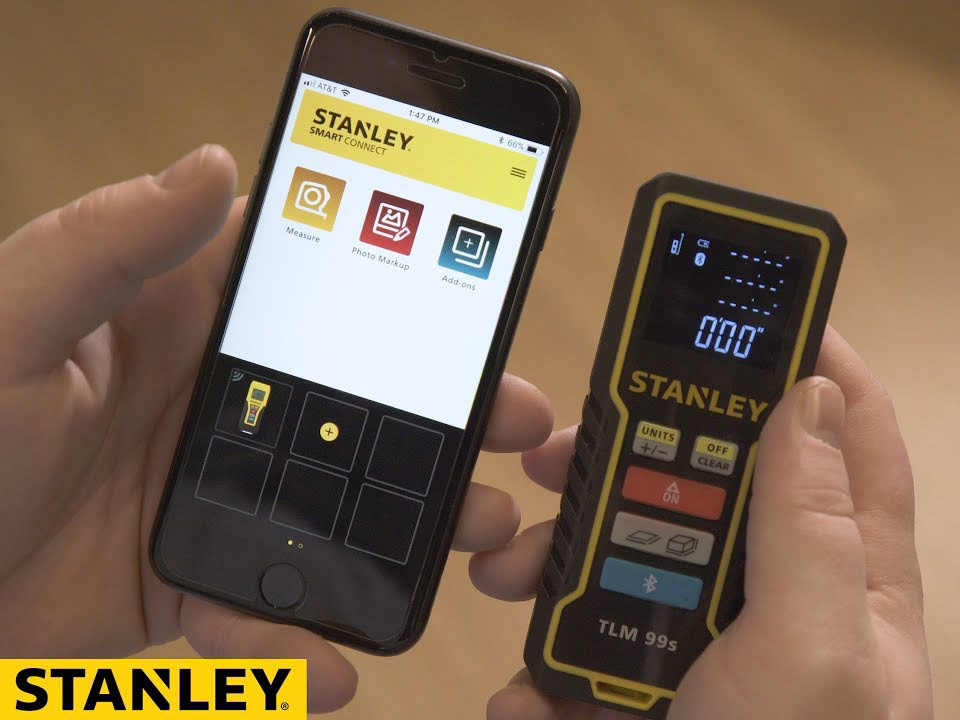
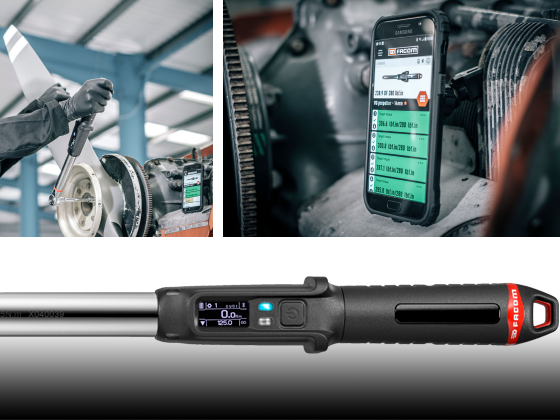
Assets are tagged and detected by beacons placed throughout the jobsite. Technologies like LoRa and GPS then convert the signal and send data to the cloud.

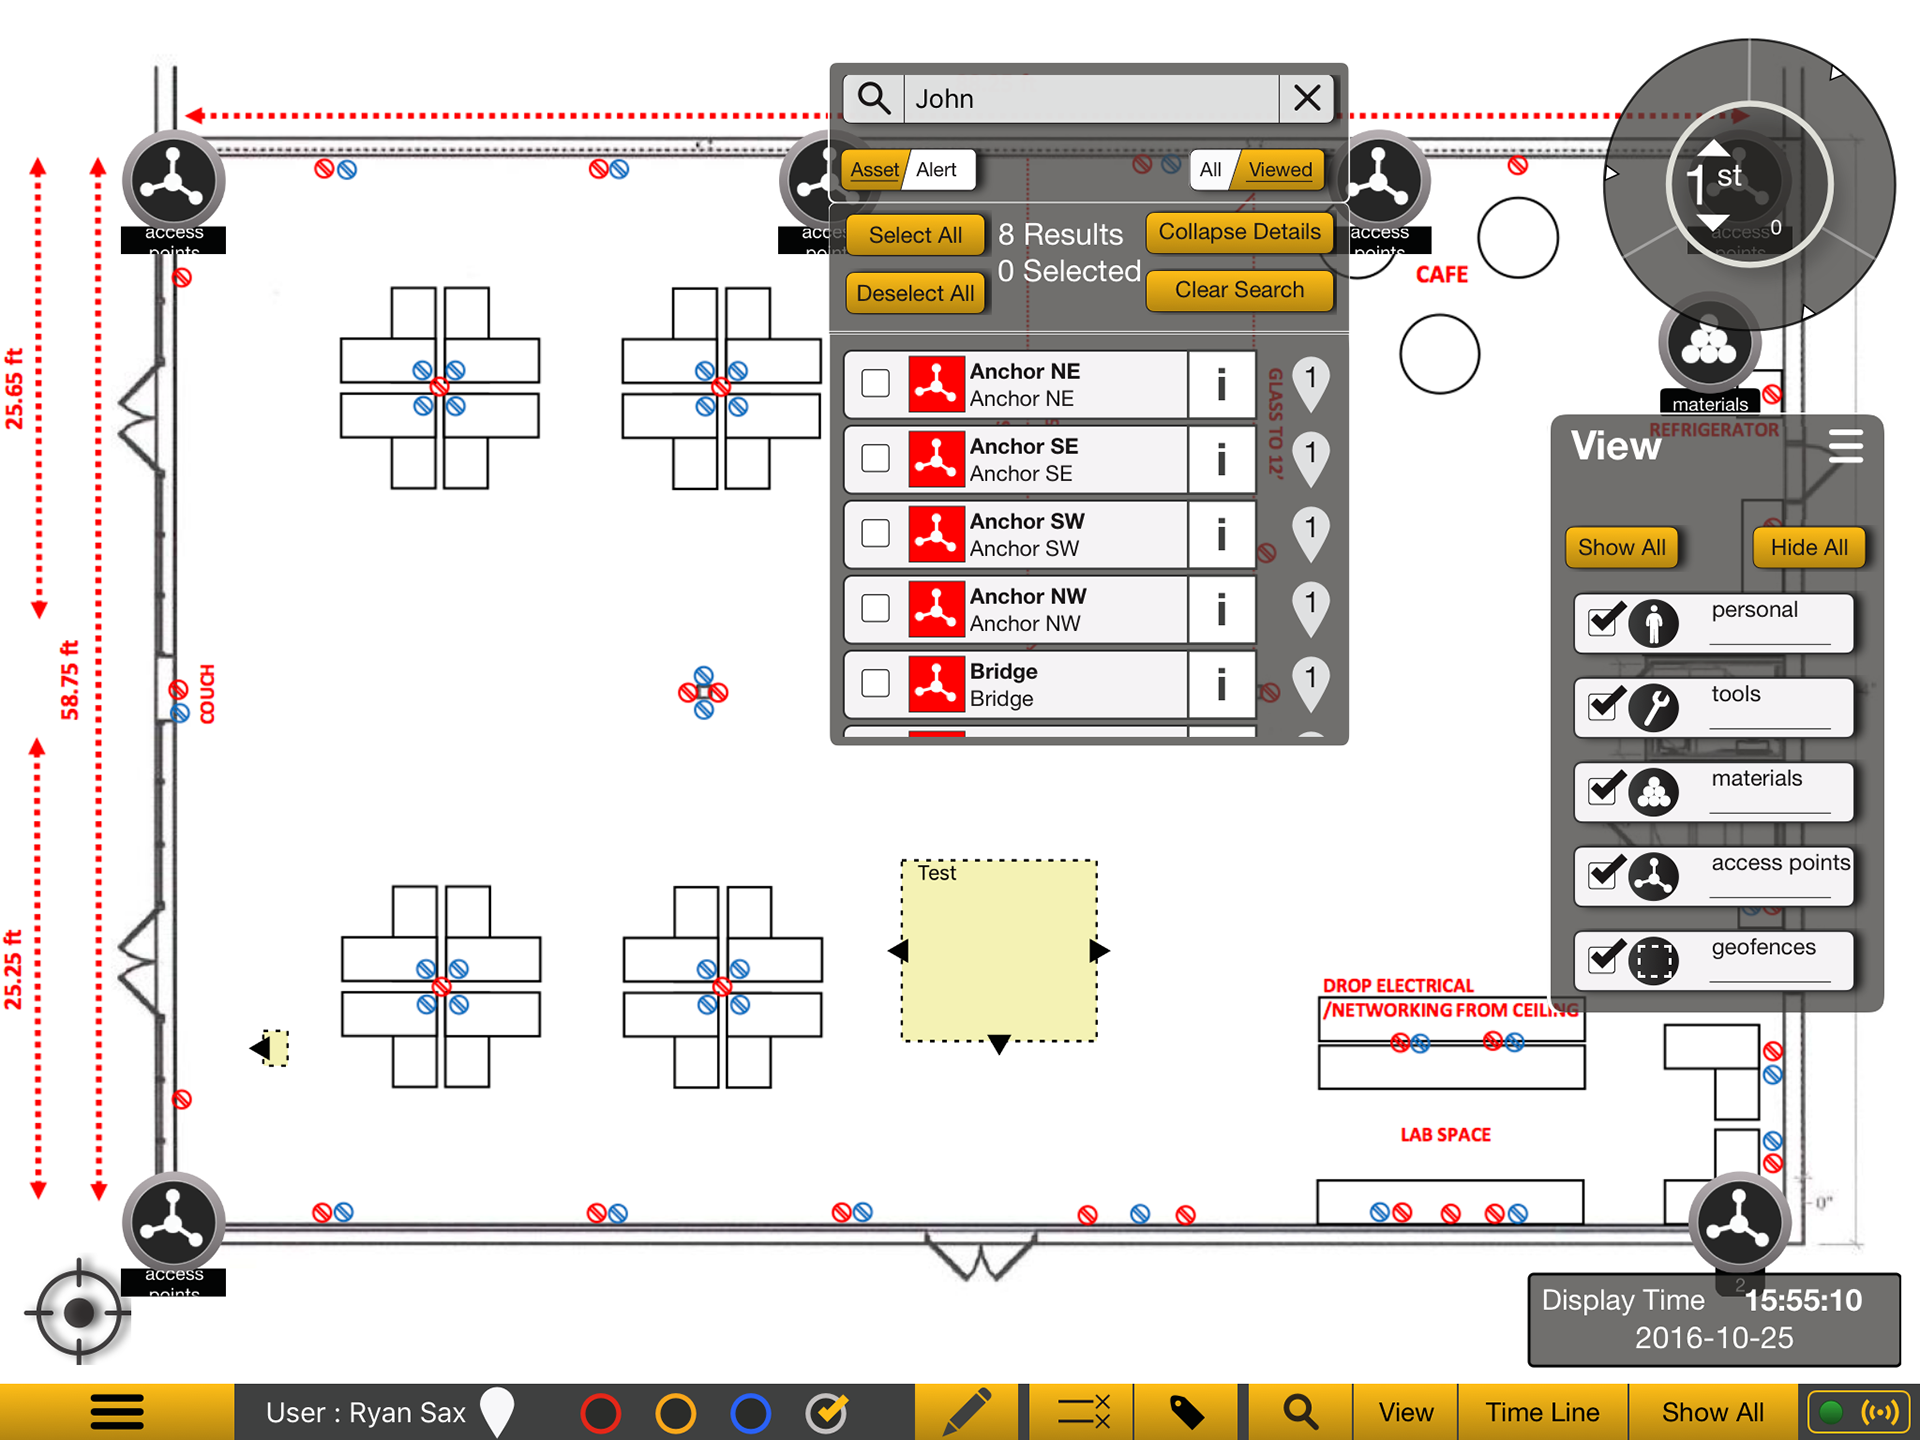
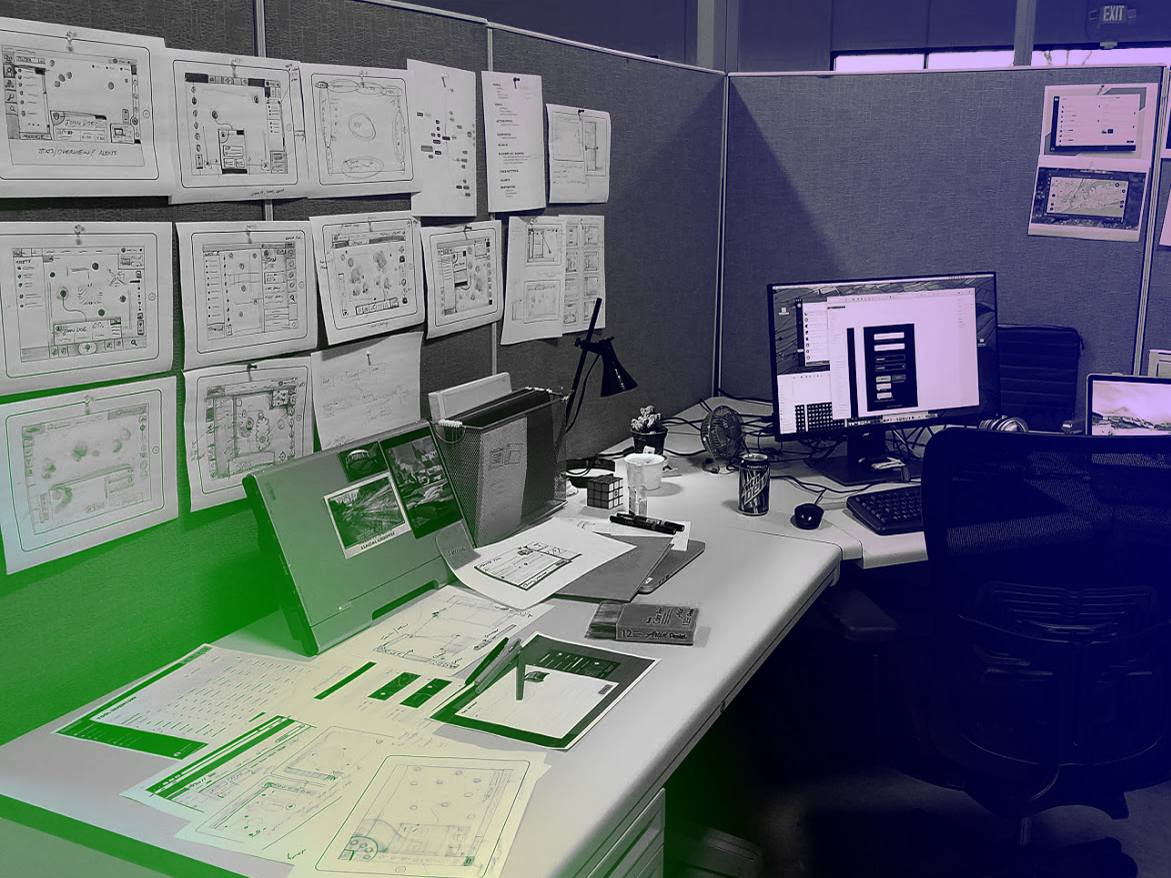
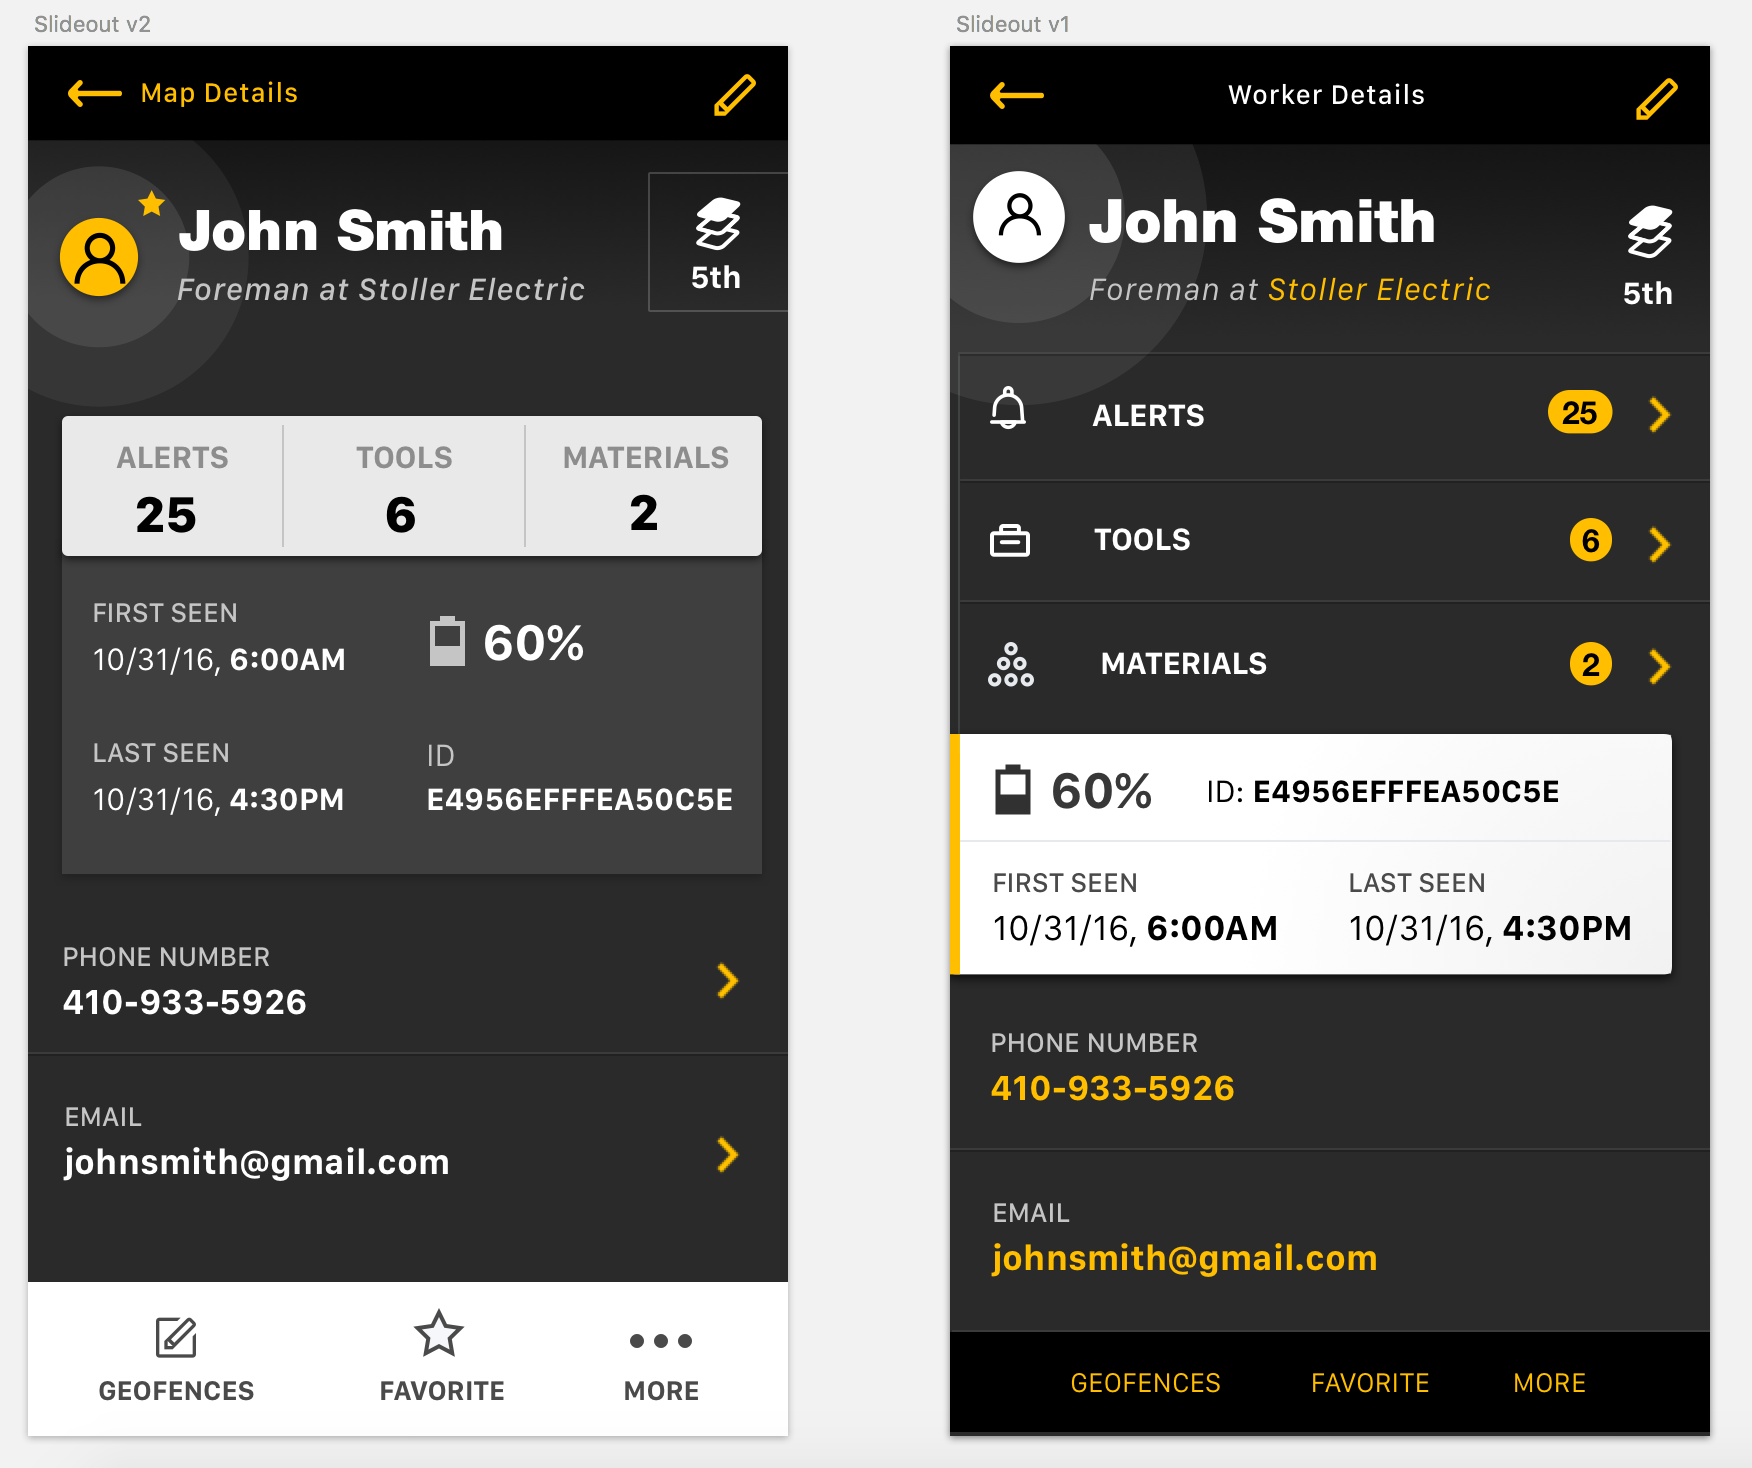
Various iPad iterations were designed. The app started out very bare bones but was slowly updated for a better brand UI experience.

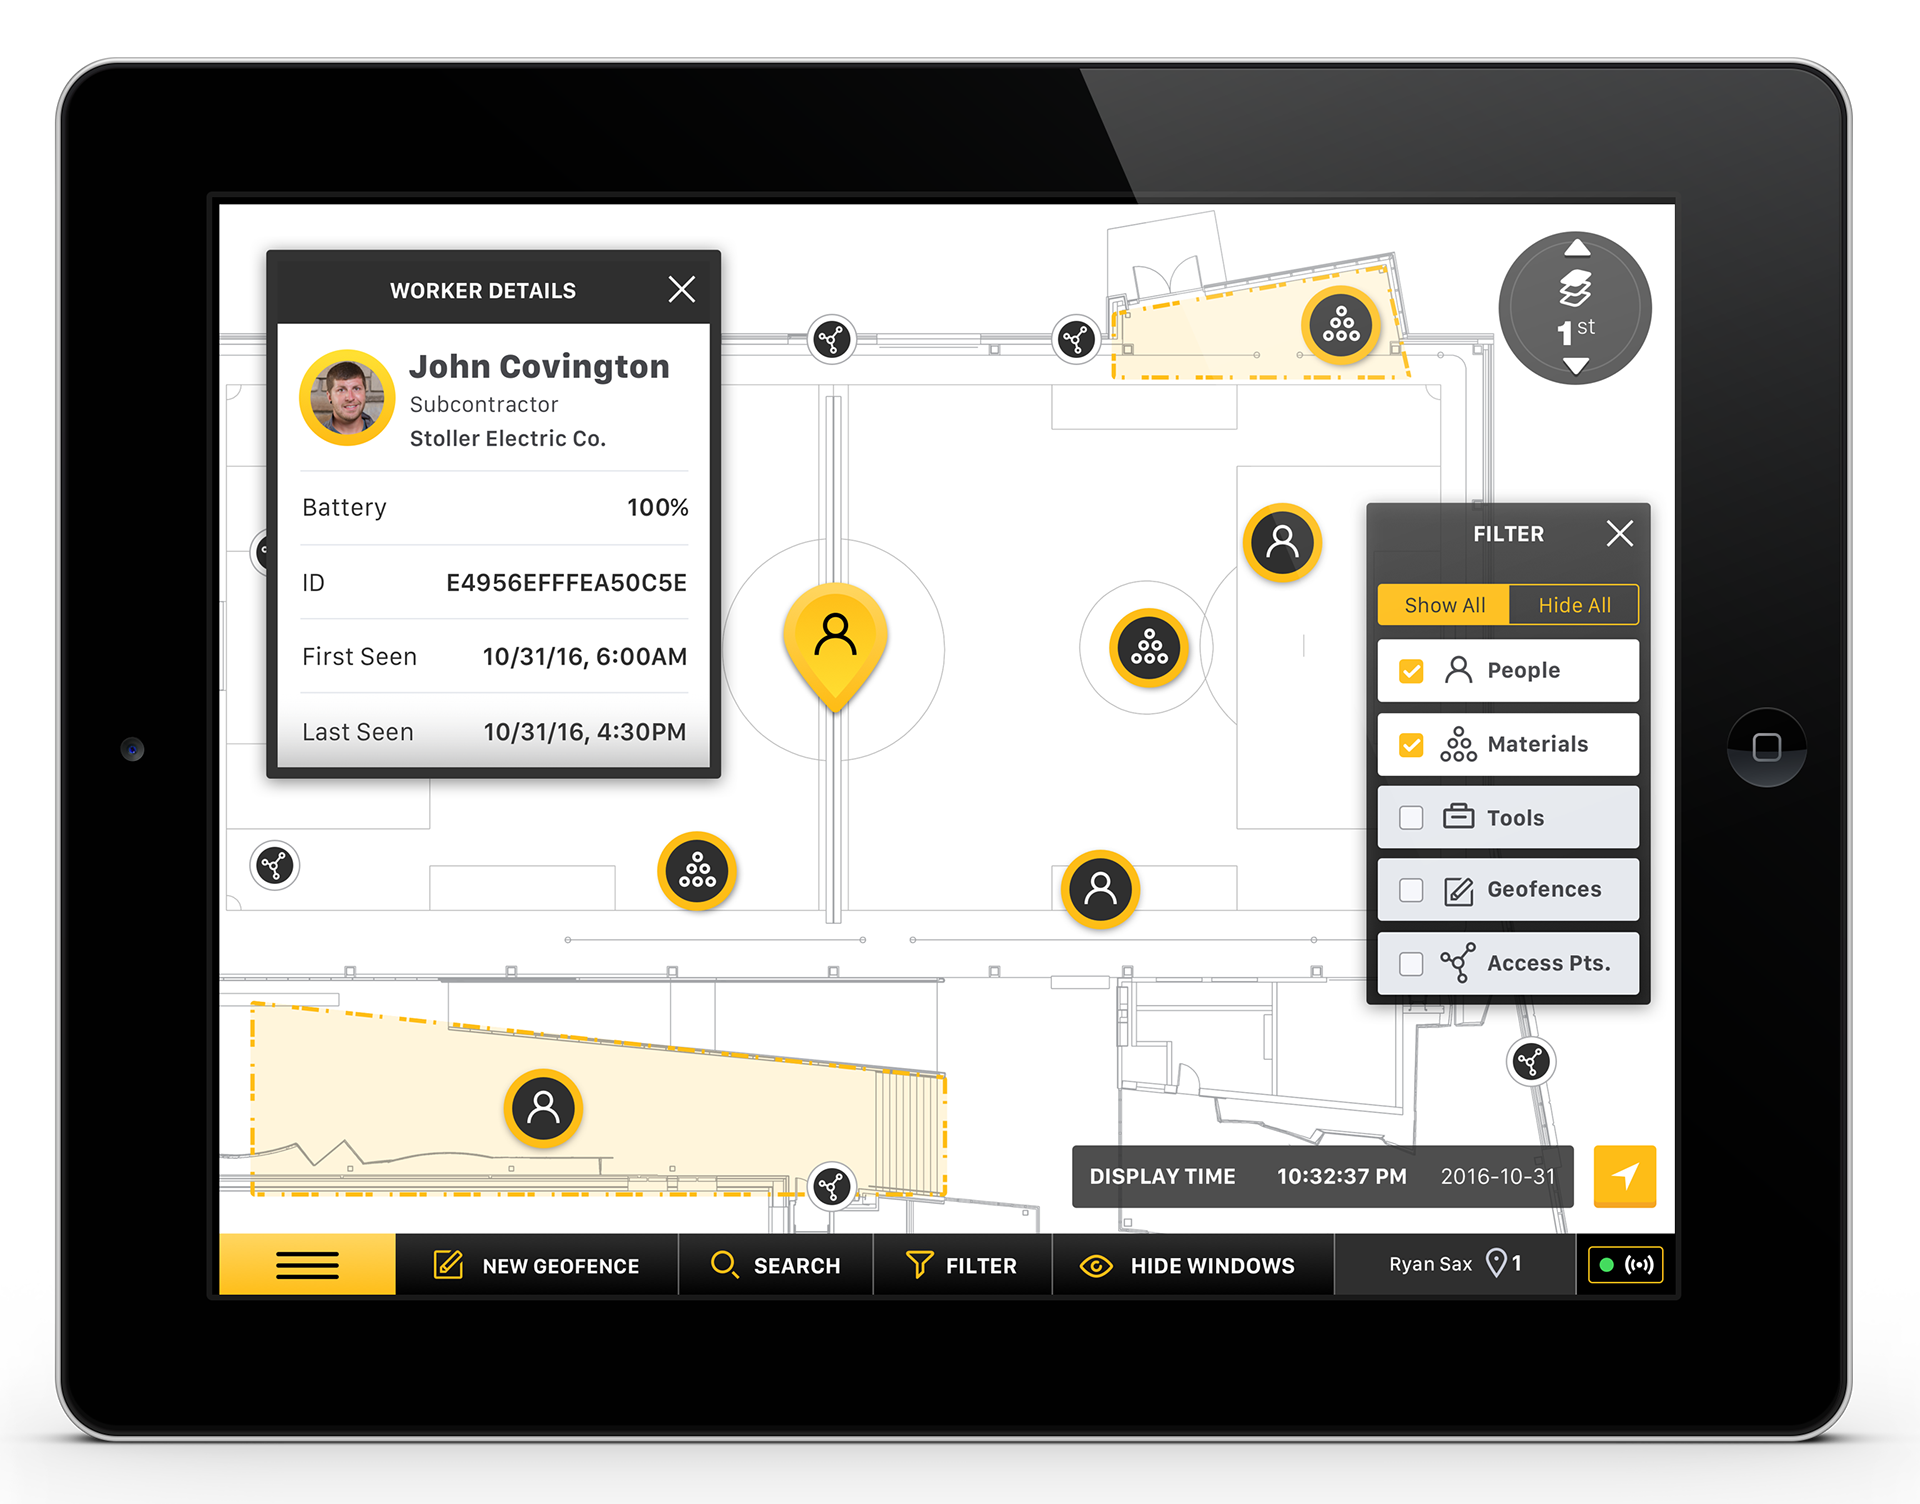
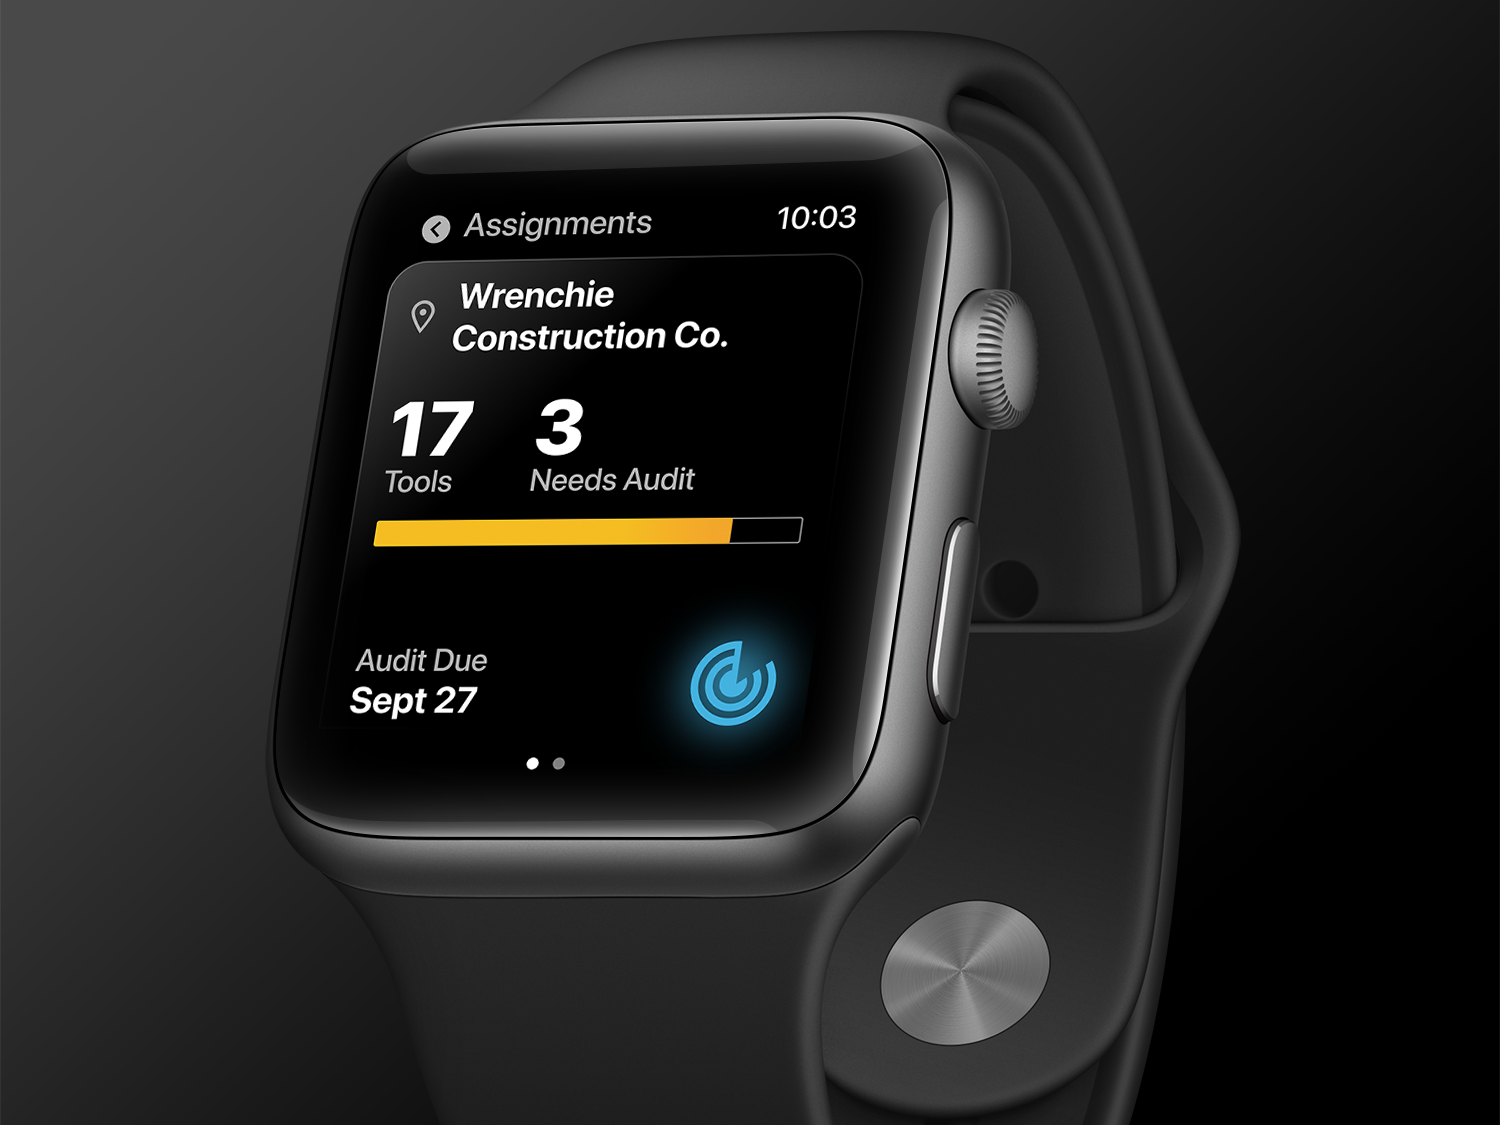
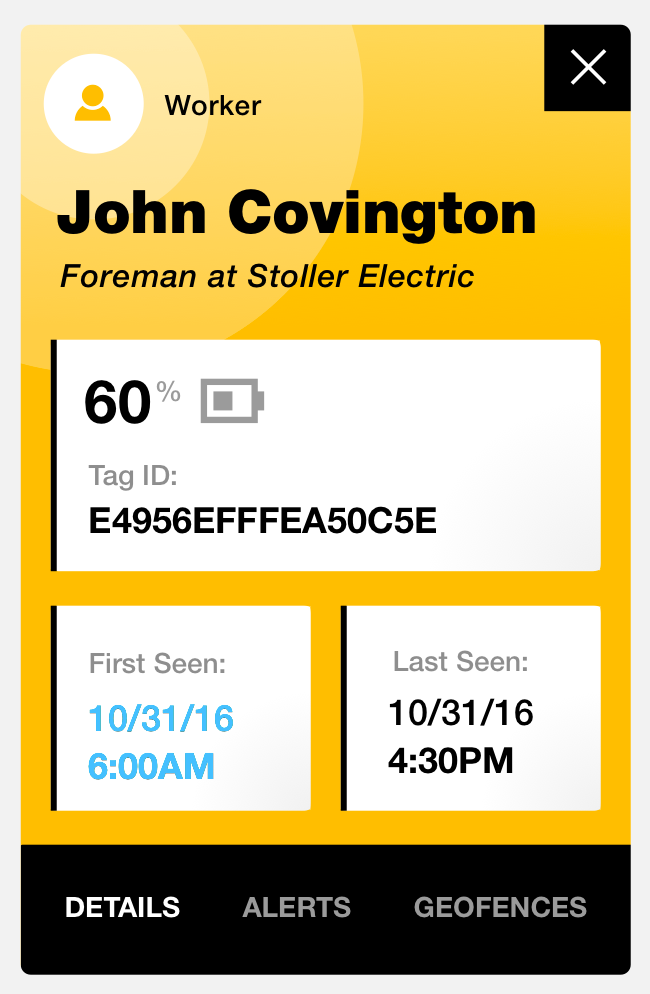
Last design iteration. Cleaner visuals and iconography and updated UI for large gloves and hands. Also able to switch to dark mode in settings for lighting changes.

Quick walk through an active site showing reader placement. Tagged assets are sniffed in zones and given a timestamp, we can then use this data for heat-mapping and movement visualization.

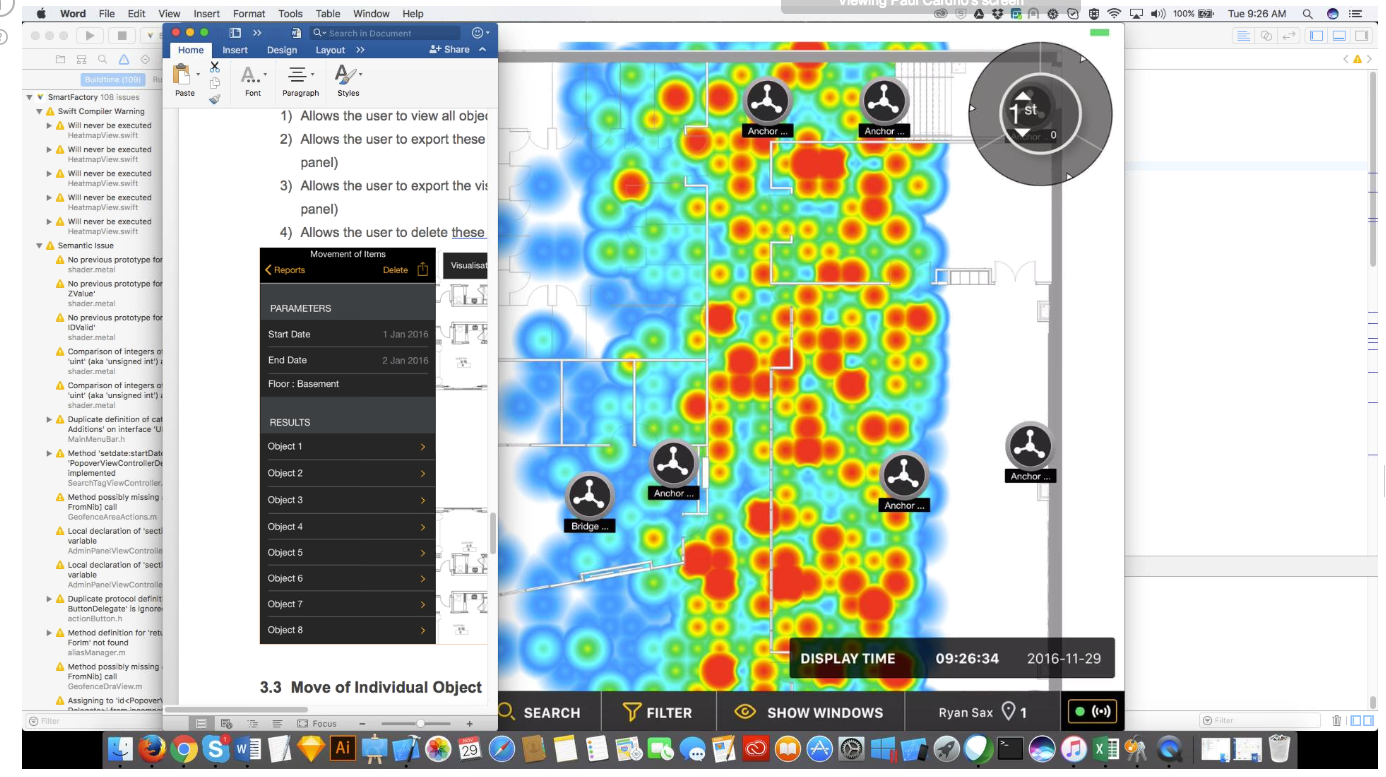
Heatmap View, R&D. Red areas show the most trafficked areas on the jobsite for a given period.

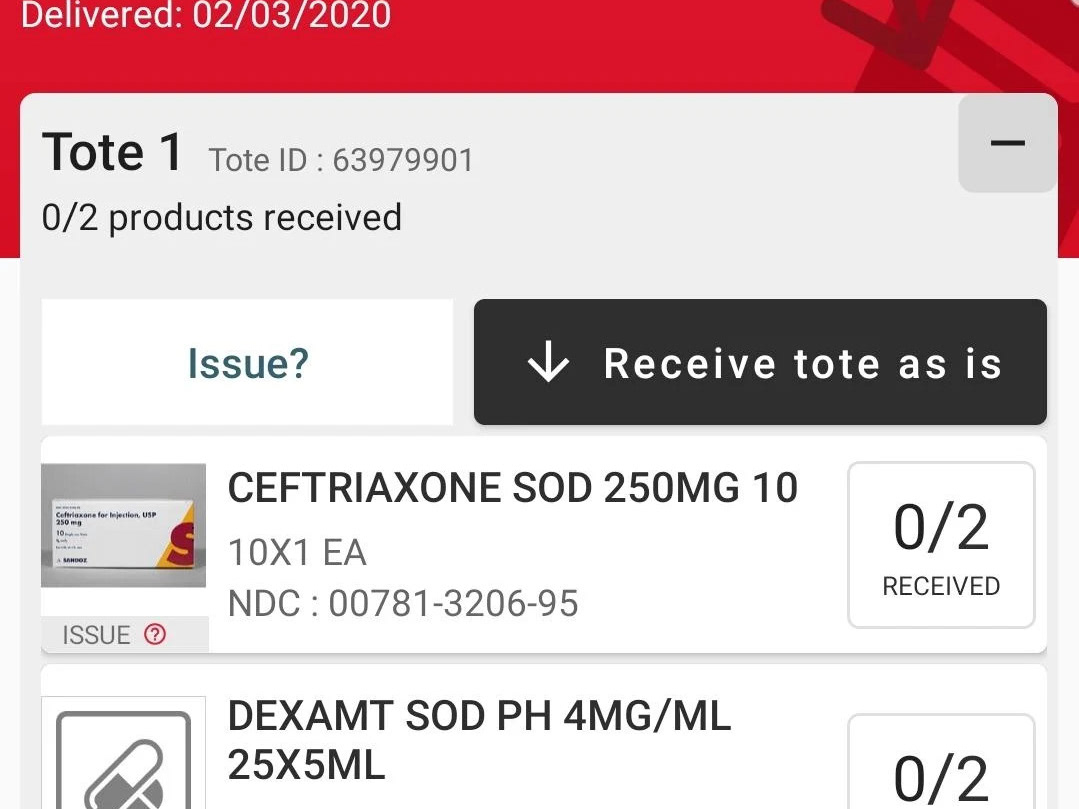
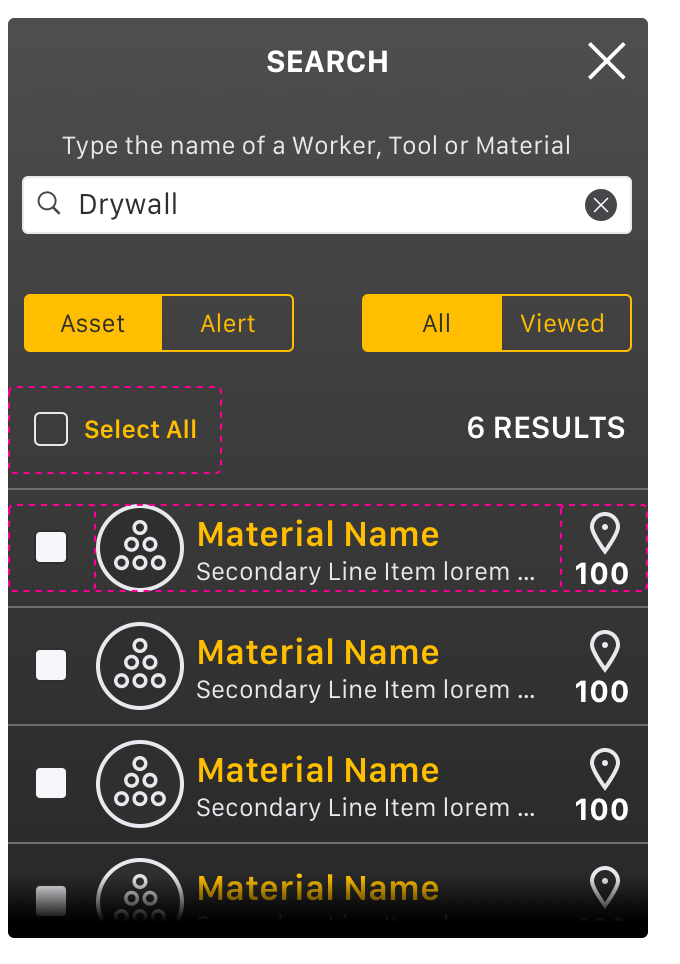
Demo of admin functions. Able to edit information about assets and tags as well as define what is shown or hidden.

While not elegant, here is a proof of concept showing movement of assets and people on the jobsite as well as switching floors to change the map layout. 

You may also like

Back to Top